 3:25
3:25सारांश. Dashboard table widgets in GoHighLevel can display custom fields alongside standard pipeline data. After adding a table widget and selecting Opportunity Count or a similar metric, the column picker exposes both built-in fields and any custom fields you have created for opportunities or contacts. This makes it practical to build management views, support queues, or project trackers directly inside the dashboard without a separate reporting tool.
स्टेप
Add a table widget to your dashboard
Click Add Widget, choose the Table chart type, then select Opportunities and Opportunity Count as the data source.
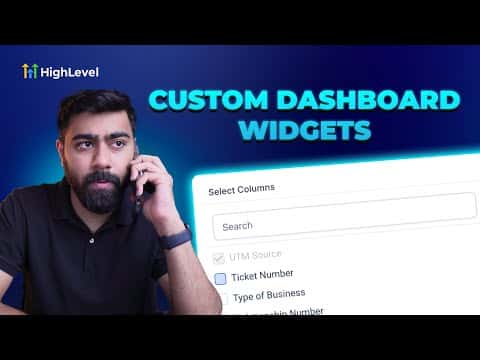
Select your columns
Click Select Columns. Add the fields that matter for your view, such as opportunity name, stage, and any custom fields you have defined. Remove columns you do not need.
Name and save the widget
Give the table a descriptive name, click Apply Columns, then Save. The table appears on your dashboard and updates as opportunity data changes.