 1:30
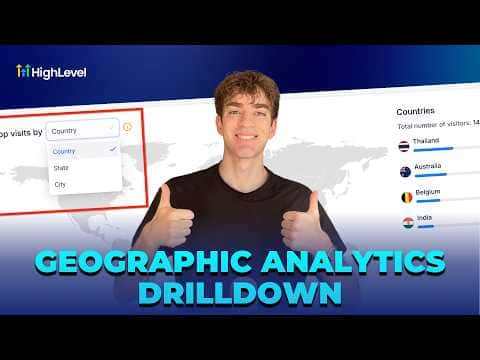
1:30概要. GoHighLevel's Geographic Analytics sits inside the Sites analytics dashboard and maps visitor traffic by country, state, or city. A toggle at the top of the map switches between location levels, and hovering over any region reveals the exact visit count. The ranked list alongside the map lets you quickly spot which areas drive the most traffic, so you can focus ad spend and campaigns where they will have the most impact.
ステップ
Open the Analytics dashboard
Inside your GoHighLevel sub-account, click Sites in the left menu, then select Analytics from the tabs at the top.
Scroll to Geographic Analytics
Scroll down past the main analytics cards until you see the Geographic Analytics map section.
Switch between country, state, and city views
Use the toggle in the top-left corner of the map to change the location level. Click State or City to drill into more specific data.
Read traffic by region
Hover over any shaded region on the map to see the visit count for that area. Check the ranked list on the right side for a sorted breakdown.