Reporting & Dashboards

GoHighLevel Dashboard Widgets: A Complete Guide to Every Category

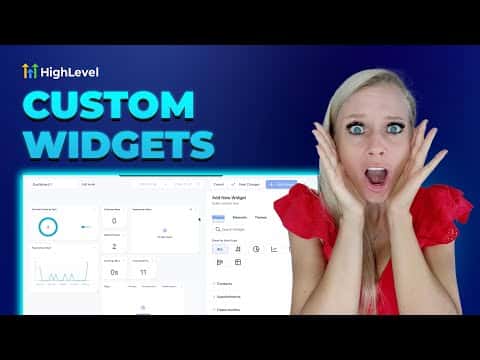
GoHighLevel dashboard widgets pull CRM data into a single view, covering contacts, appointments, opportunities, pipeline value, email campaign stats, call activity, conversation volume, payment totals, and visitor data. Each widget supports multiple chart types including numeric, donut, bar, line, and table. Categories and predefined metrics make it fast to find what you need without building from scratch.

2026年6月2日に更新

10:09

概要. This tutorial covers every category of GoHighLevel dashboard widgets, from contacts and appointments to calls, conversions, payments, and visitor data. It also explains the Elements tab for adding titles, images, text blocks, and embed widgets, and touches on the Themes panel for changing the visual style of the entire dashboard.
よくある質問

What widget categories are available in GoHighLevel dashboards?

Contacts, appointments, opportunities, visitor data, emails, calls, conversations, payments, and general.

Can I show data as a table instead of a chart?

Yes. When adding a widget, select Table from the chart type options.

What are Elements in the dashboard widget panel?

Elements let you add titles, text blocks, images, and embeds to organize and annotate your dashboard layout.

Can I filter a widget to show only a specific metric like average call duration?

Yes. Select the widget, then choose from the available metrics such as average, sum, minimum, maximum, or count.

すでに作った人たちと、一緒に作ろう。

無料コミュニティに参加しましょう。毎週のライブ通話、最初に見るコース、あなたの言語のビルダーがいます。

Skoolに無料で参加